|
|
MODELLING LAND USE DYNAMICS IN THE SPANISH NETWORK OF NATIONAL PARKS AND THEIR HINTERLAND (DUSPANAC) |
|
|
FIRST PARTICIPATORY WORKSHOP OF THE DUSPANAC PROJECT, FEBRUARY 22 2012 RESULTS OF ACTIVITY 2 - Participatory analysis of land use change dynamics in Doñana and its area of influence Our aim in this activity was to define, together with stakeholders, the change processes that reflect the current land uses in Doñana and its environs. The relevance of this activity depends on the participants, since it is they who can provide the information about what is really going on in the territory, in other words, they will be the "eyes" of the DUSPANAC team and the information they give will be incorporated into the model. Mapped examples of 9 land use change dynamics previously observed by the research team (the most obvious or most easily detected from cross-tabulation analysis of land use change) were given out to participants in order to provoke internal debate in each group with respect to the following questions:
In groups, these 3 questions were discussed for each of the 9 land use change dynamics presented. The information discussed was then systematically transferred in written form to the wallchart (using yellow, blue and pink postit notes). The work of each group was then presented to all participants in a common discussion session by a spokesperson chosen for each group, who also took responsibility for transferring the postit notes with the dynamics collectively agreed by the group to the wallchart (a continuous roll of paper). 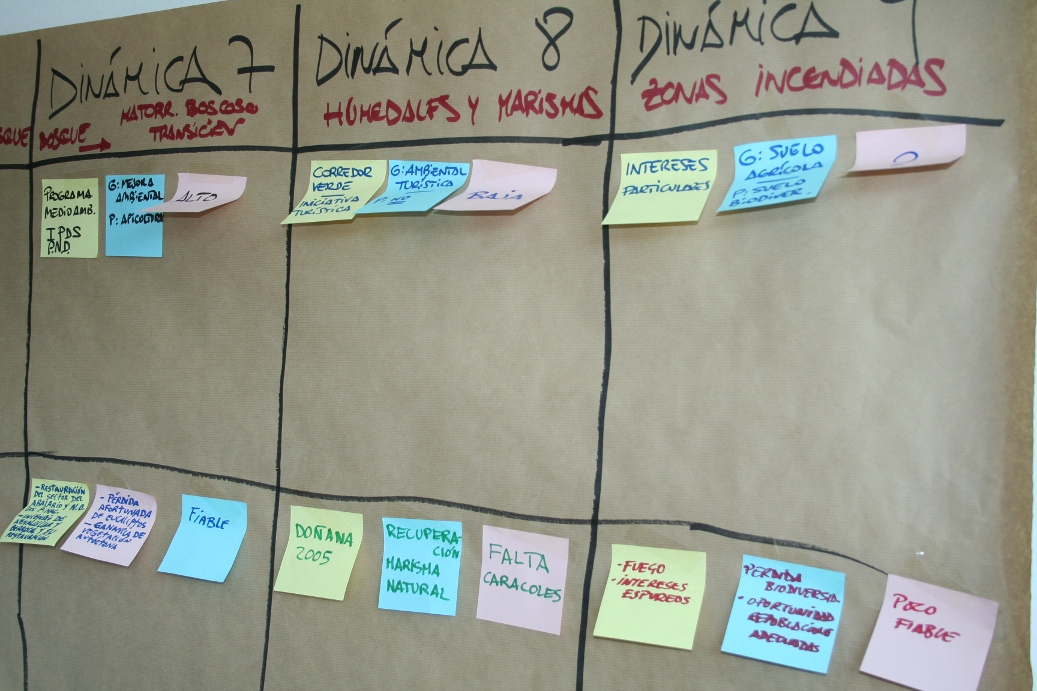
Transferring information about land use change dynamics from each group onto the wallchart using postit notes. 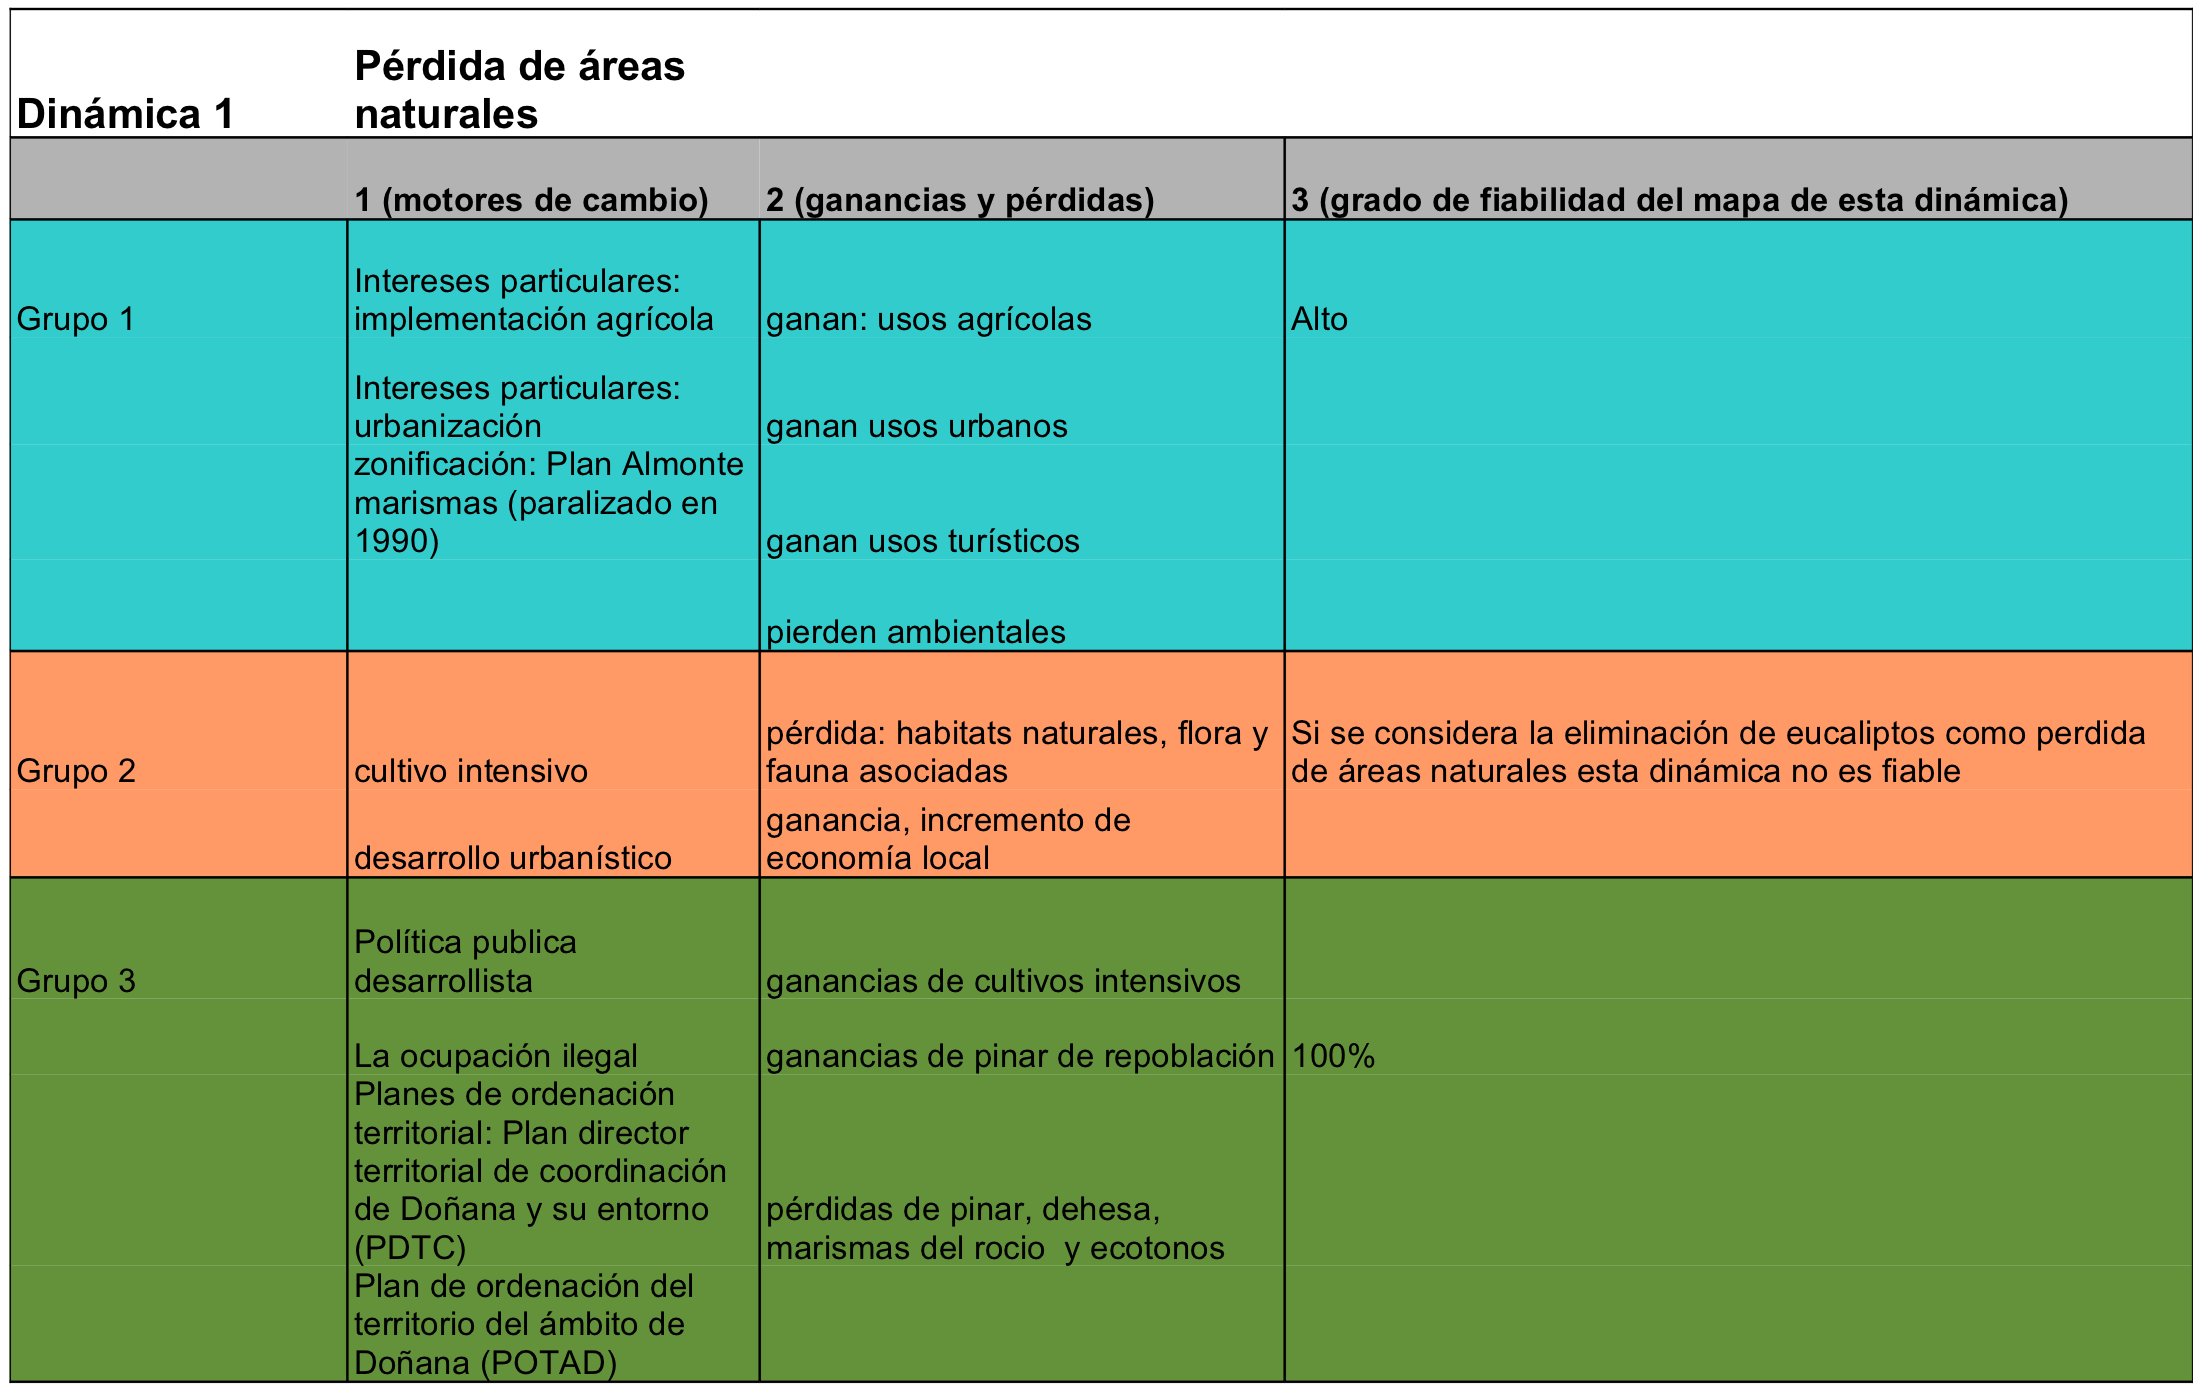 Results of the participatory analysis of land use dynamics transferred to a data base table |
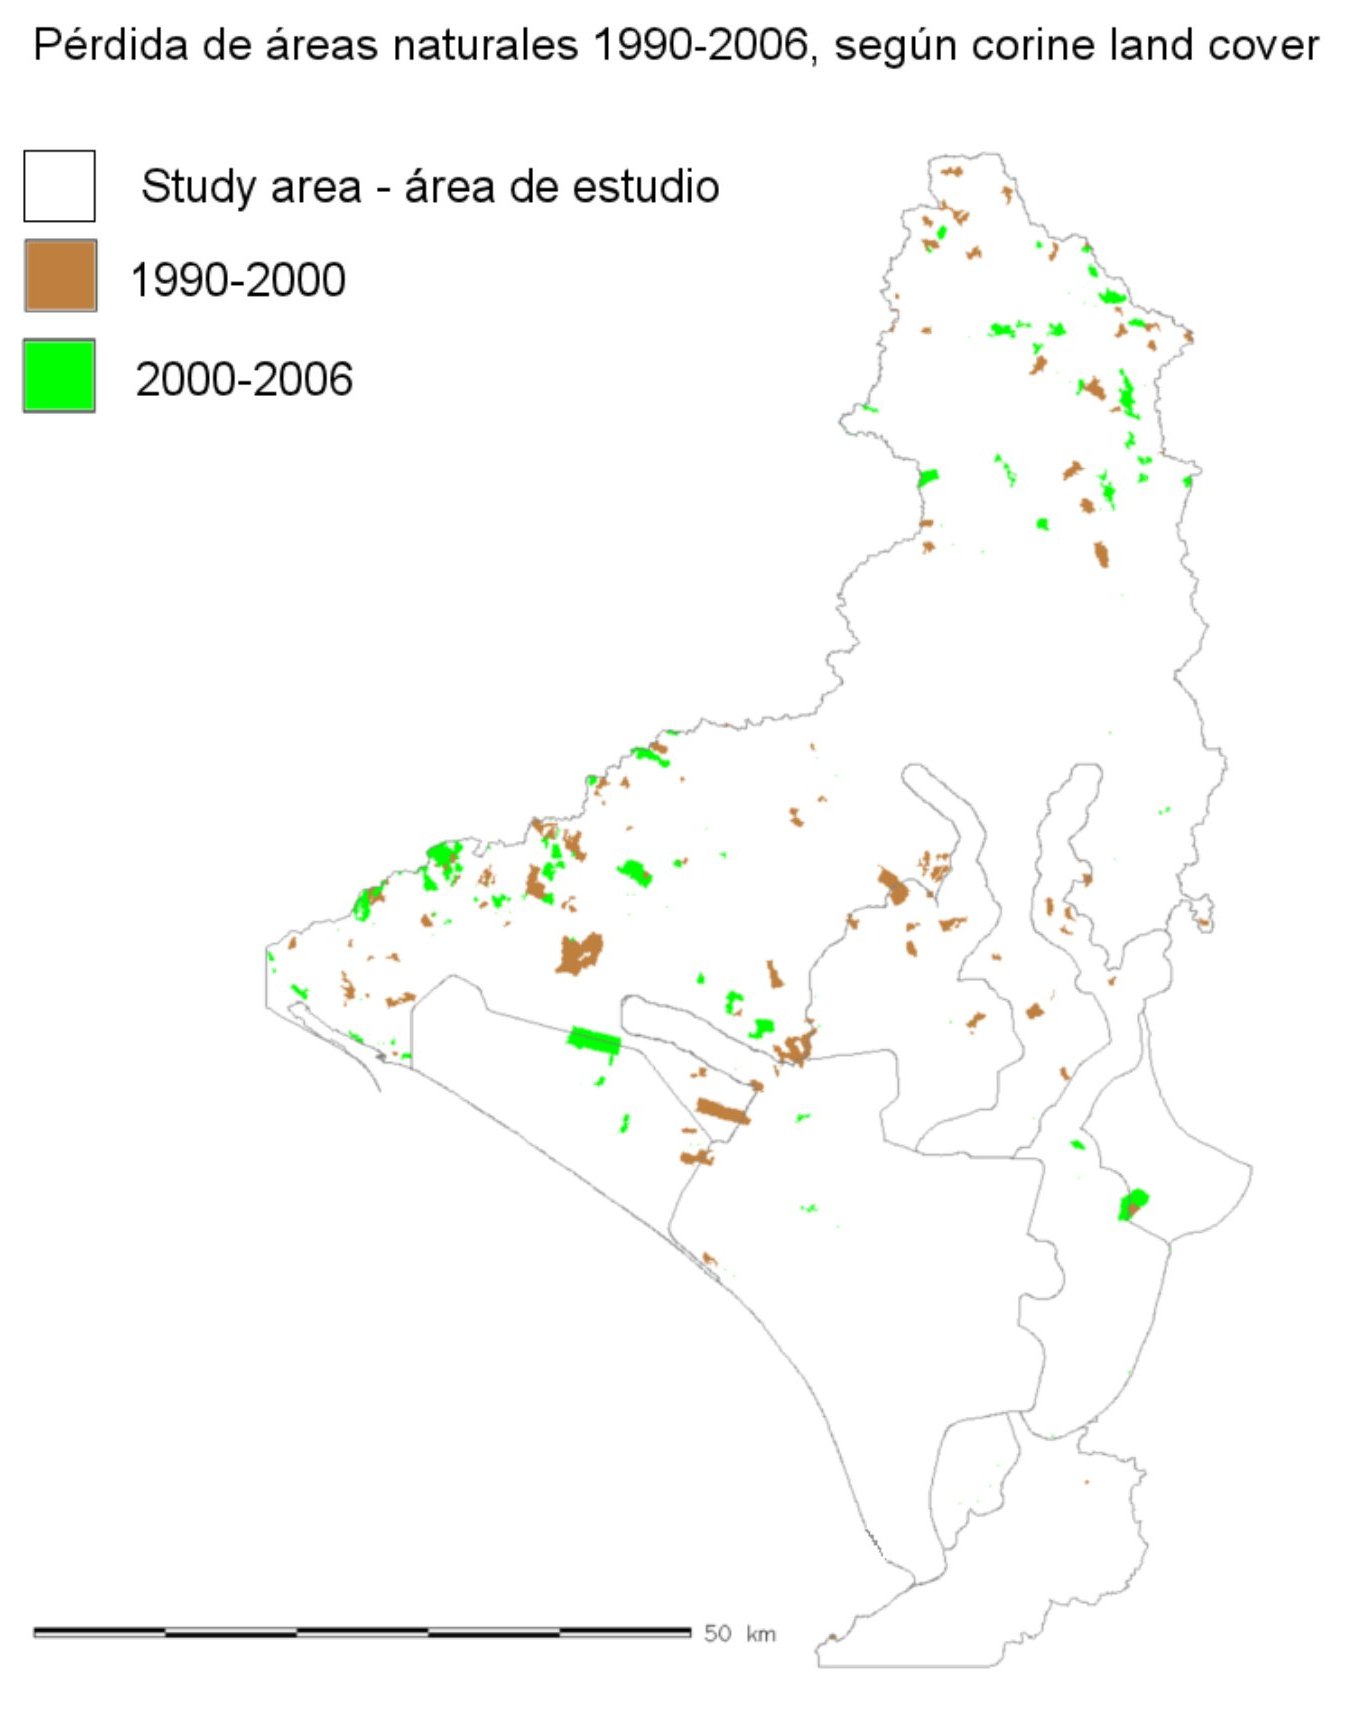
Dynamic 1, decline of natural areas 1990-2006 (Click on the image to show full-size) 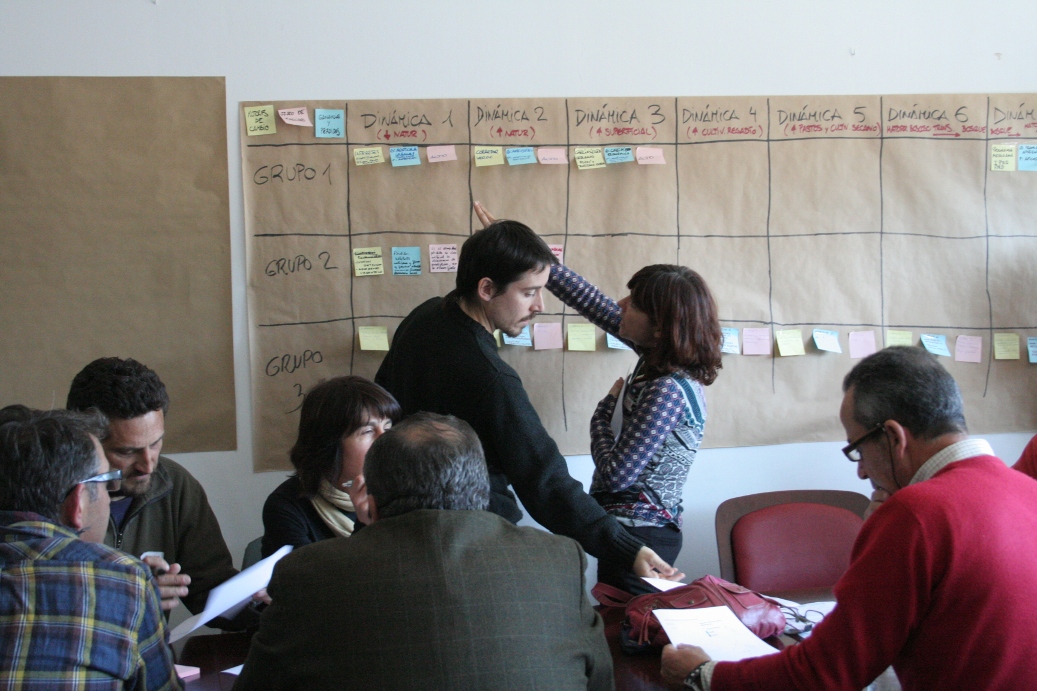
Transferring each group's information to the wall chart 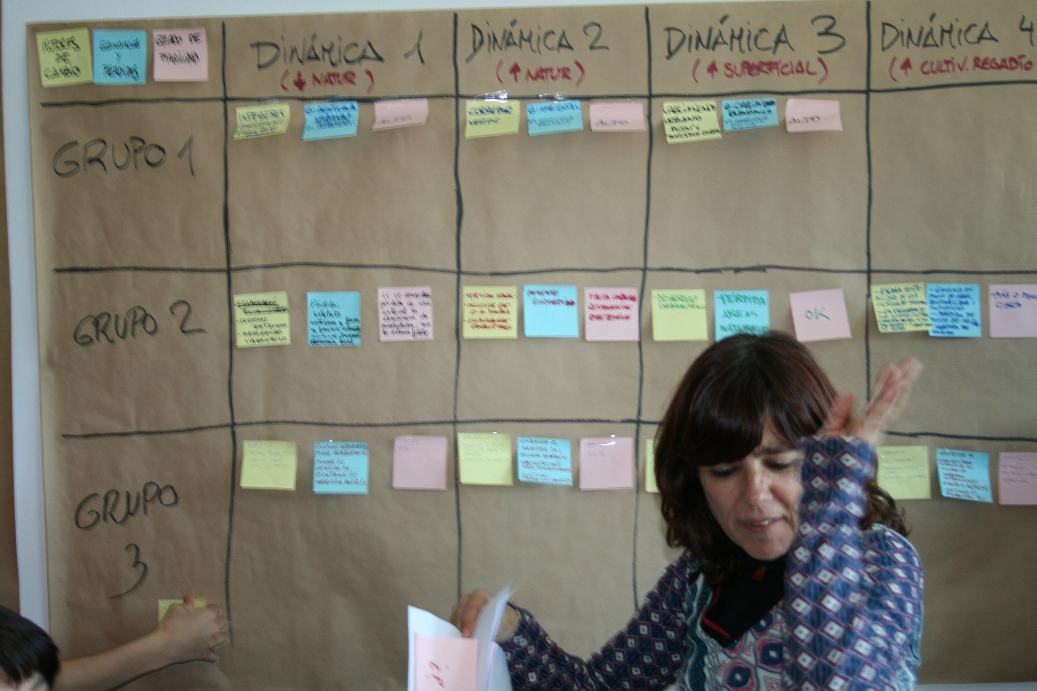
Presentation of results of participatory anaysis of land use dynamics by each group Results of Activity 2 Results of participatory analysis of land use dynamics Activity sheets for the 9 dynamics analysed by stakeholders
|
 |
 |
 |