|
|
MODELLING LAND USE DYNAMICS IN THE SPANISH NETWORK OF NATIONAL PARKS AND THEIR HINTERLAND (DUSPANAC) |
|
|
DUSPANAC GIS Documentation Chapter 3: Carrying out the cross tabulation analysis for all 14 national parks Using the raster land use maps that we created in the previous chapter, we now need to compare the national park areas across all three dates. We will do this using the cross tabulation analysis command (TableCross) in ILWIS 3.7. For each park we will cross-tabulate the following maps: 1. National park core protected area. 2. National park with PRUG area or 800m buffer zone. 3. PRUG area or buffer zone only. This was undertaken with the following command in ILWIS: newaigprug00to06=TableCross(aig00prug,aig06prug) A series of contingency tables was produced from this command, six for each park, e.g. for aigüestortes: 1. newaig90to00 2. newaig00to06 3. newaigprug90to00 4. newaigprug00to06 5. newaigbuff90to00 6. newaigbuff00to06 We can also produce change maps, showing areas of change and areas of no change, to help illustrate our analysis. This is done in the following way: aigchange90_00=newaig90park<>newaig00park This produces a Boolean (True or False) map. If we want to convert this to a binary map with 0 (no change) and 1 (change), we need to do the following: aigchange90_00bin:=IFF(aigchange90_00<>TRUE,0,1) In other words, if the values in aigchange90_00 are not equal to TRUE, then give them value 0. Otherwise, give them value 1. Aigüestortes, our example we've been using up till now, changed hardly at all. But other parks did show more change, for example, monfragüe, in Extremadura, showed some extensive areas of (mostly vegetational) change: 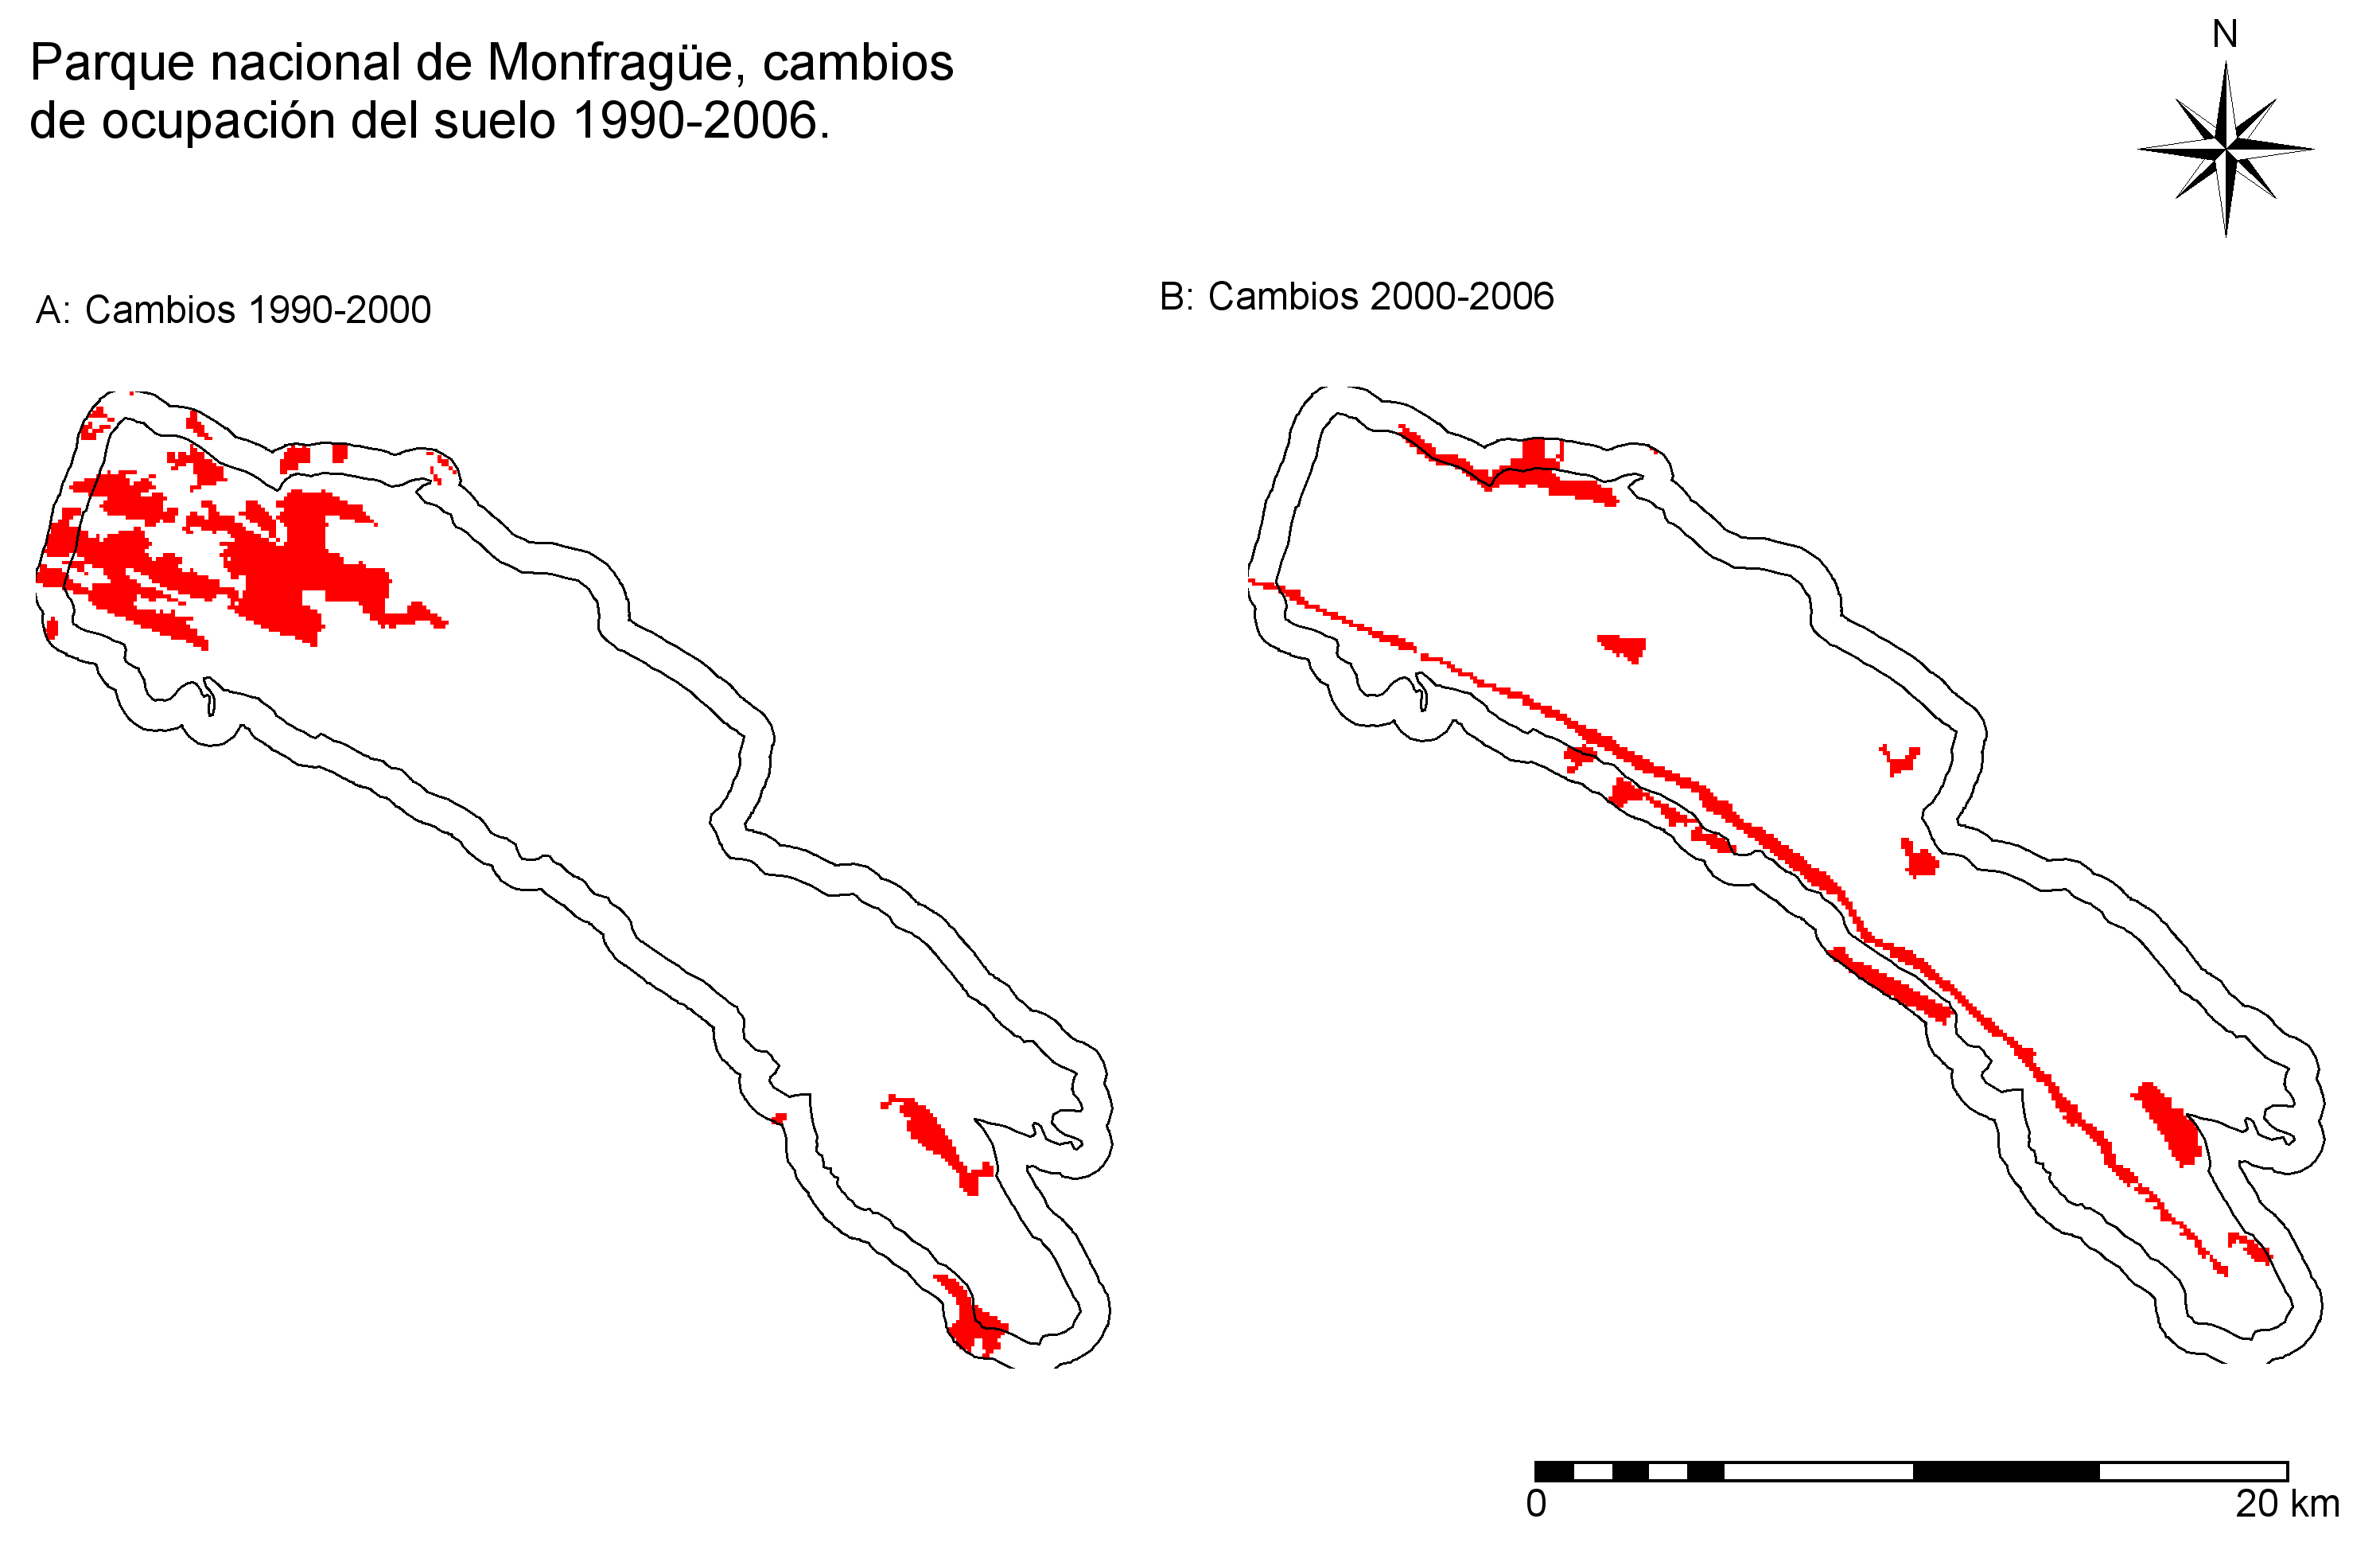 |
 |
 |
 |